-
توجه: در صورتی که از کاربران قدیمی ایران انجمن هستید و امکان ورود به سایت را ندارید، میتوانید با آیدی altin_admin@ در تلگرام تماس حاصل نمایید.
You are using an out of date browser. It may not display this or other websites correctly.
You should upgrade or use an alternative browser.
You should upgrade or use an alternative browser.
مباحث تخصصی هواشناسی و بررسی تاثیرات شاخصهای دور پیوندی و مولفه های اتمسفری در تابستان و پاییز و زمستان 1393
- شروع کننده موضوع heaven1
- تاریخ شروع
Amir Mohsen
متخصص بخش هواشناسی
آخرین وضعیت انسو

آخرین ویرایش:
Amir Mohsen
متخصص بخش هواشناسی
مقایسه تغییرات ناگهانی دمای آب در ناحیه نینو:
16 و 18 ژوئن 2014


16 و 18 ژوئن 2014
آخرین ویرایش:
Amir Mohsen
متخصص بخش هواشناسی
[h=2]El Nino Sends Mixed Signals [h=3]June 21, 2014
 click to enlarge
Planet 3.0


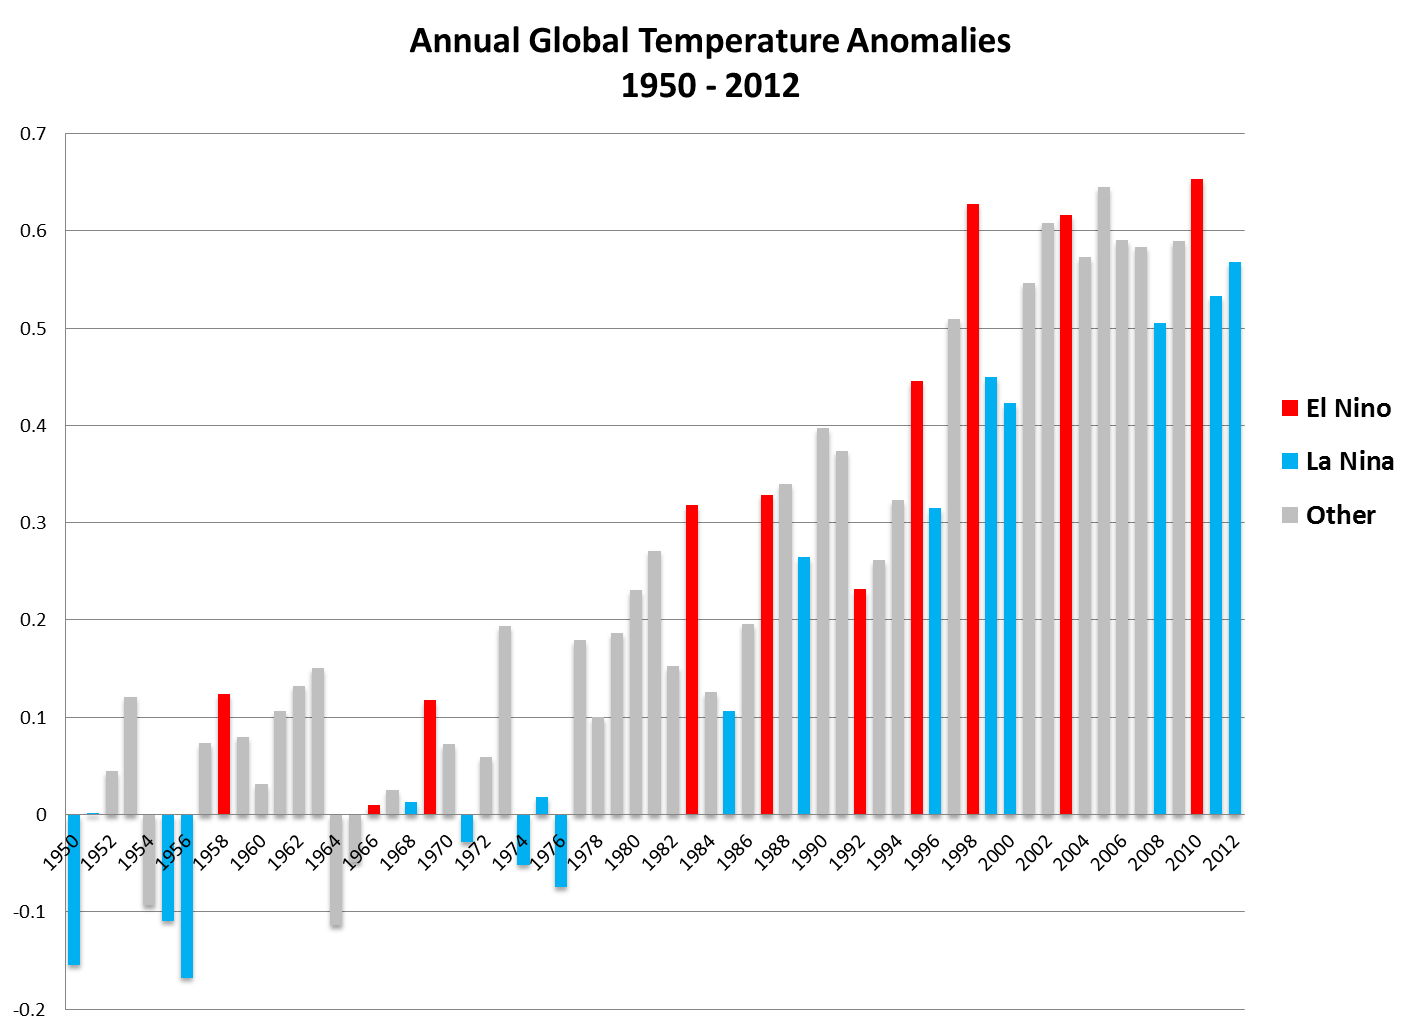
As the chart above suggests, even a small ripple in the amount of heat that the oceans absorb can make a huge difference in global surface temperature trends from year to year. Already, even with a still nascent nino, this year could be on track to set new records.
Climate News Network:
Scientists believe that soaring global temperatures during an unusually hot month of May may have created the ideal conditions to provide a warm welcome for an El Niño weather phenomenon that will break records
LONDON, 20 June, 2014 − Last month was the third warmest May since NASA satellites began taking the temperature of the planet 35 years ago, and was also the warmest May that did not fall within an El Niño Pacific warming event – which could mean a record-breaking appearance this year by the fearsome “Child”.
Scientists in the US says the global average was 0.33°C warmer than the seasonal norms for the month. The warmest May ever was in 1998 during the “El Niño of the century”, when global average temperatures rose by 0.56°C, and the second warmest at 0.45°C was in 2010, another El Niño year.
So if indications are correct that an El Niño event is taking shape in the Pacific right now off the equatorial coast of South America, then it could become a record-setter − even if it isn’t a very spectacular event − just because it will get a warmer start, according to John Christy, professor of atmospheric science at the University of Alabama in Huntsville, US.
[h=3] An El Niño (Spanish for The Child, because it was first observed by Peruvian fishermen around Christmas) is a shift in the temperature patterns of the Pacific, as a blister of equatorial ocean heat moves eastwards. It is a natural cyclic event that tends to reverse the prevailing Pacific weather patterns, often damagingly, and is not connected with climate change − although its effects could be made worse by climate change.
“The long-term baseline temperature is about three tenths of a degree warmer than it was when the big El Niño of 1997-1998 began, and that event set the one month record,” Christy said. “With the baseline so much warmer, this upcoming El Niño won’t have very far to go to break that 0.66°C record. That isn’t to say it will, but even an average-sized warming event will have a chance to get close to that level.”
 click to enlarge
Planet 3.0
It’s early days and it may not pan out, but we’re still on track for a Super-ENSO.
The image (Slide 43 in this briefing) shows the evolution of the equatorial temperature anomaly through time in the two super-El-Ninos in the observational record, and the evolution to date of the current likely El Nino.
The graph below shows that while “warm” el nino years are most often when global temperature records are set, even “cool” la nina years continue to get warmer as the planet collects more heat, most of which is stored in the ocean.The image (Slide 43 in this briefing) shows the evolution of the equatorial temperature anomaly through time in the two super-El-Ninos in the observational record, and the evolution to date of the current likely El Nino.
Climate News Network:
Scientists believe that soaring global temperatures during an unusually hot month of May may have created the ideal conditions to provide a warm welcome for an El Niño weather phenomenon that will break records
LONDON, 20 June, 2014 − Last month was the third warmest May since NASA satellites began taking the temperature of the planet 35 years ago, and was also the warmest May that did not fall within an El Niño Pacific warming event – which could mean a record-breaking appearance this year by the fearsome “Child”.
Scientists in the US says the global average was 0.33°C warmer than the seasonal norms for the month. The warmest May ever was in 1998 during the “El Niño of the century”, when global average temperatures rose by 0.56°C, and the second warmest at 0.45°C was in 2010, another El Niño year.
So if indications are correct that an El Niño event is taking shape in the Pacific right now off the equatorial coast of South America, then it could become a record-setter − even if it isn’t a very spectacular event − just because it will get a warmer start, according to John Christy, professor of atmospheric science at the University of Alabama in Huntsville, US.
[h=3] An El Niño (Spanish for The Child, because it was first observed by Peruvian fishermen around Christmas) is a shift in the temperature patterns of the Pacific, as a blister of equatorial ocean heat moves eastwards. It is a natural cyclic event that tends to reverse the prevailing Pacific weather patterns, often damagingly, and is not connected with climate change − although its effects could be made worse by climate change.
“The long-term baseline temperature is about three tenths of a degree warmer than it was when the big El Niño of 1997-1998 began, and that event set the one month record,” Christy said. “With the baseline so much warmer, this upcoming El Niño won’t have very far to go to break that 0.66°C record. That isn’t to say it will, but even an average-sized warming event will have a chance to get close to that level.”
Amir Mohsen
متخصص بخش هواشناسی
The cold upwelling around japan by mid july will seriously dampen the developing nino.
Upwelling cold water anomalies around Japan is what we'd normally see during a +PDO and would actually enhance the prospects of The Child.

بله
تجمع آبهای سرد در دریای ژاپن به معنی مثبت بودن شاخص PDO هست که این میتونه منجر به تولد و رشد کودکی به اسم النینو بشه
El Nino may cause weak monsoon & high prices; poses serious challenge to Modi government
The first big challenge to Narendra Modi's prime ministerial skills is now possibly in plain sight — and it's developing not in India but thousands of miles away off the coast of Peru, South America. The now-notorious El Nino weather phenomenon is not yet fully developed — it will reach its full fruition around September and October, but already it is being linked to a weak monsoon, soaring prices of vegetables and the possibility of poor agricultural output.
The BJP fought this election around the inability of the previous government to rein in inflation and the rising prices of essential commodities. Now it is faced with the very real possibility that inflation could well head higher in the coming months. The signs are hardly positive.
The monsoon shortfall is currently around 42% and with land temperatures high and little sign of rain in a number of regions, crop planting is delayed. During the 2009 drought, one of the worst India faced in many decades, rainfall deficit in June was running at similar levels.
Delayed planting of key crops such as onion has already forced prices upward. What is El Nino and how will it affect the monsoon? The big problem here is one of uncertainty — about the future path of the monsoon, about the extent of any weakness in rainfall and even the extent of the El Nino phenomenon.
"It has been, and still is, very difficult to predict the monsoon and the effect of the El Nino on it," points out Balaji Rajagopalan, professor at the University of Colorado in Boulder (US), who has researched the links between the Indian monsoon and the El Nino.
The El Nino Cycle
Indeed El Nino, and the role it plays in periodic droughts which hit the Indian subcontinent, was one of the foundational questions that drove modern weather research. In his book on Victorian famines, writer Mike Davis calls the El Nino Southern Oscillation (or ENSO to give it its full name) the "elusive great white whale of tropical meteorology for almost a century".
And despite more than a century of research, it still, in a sense, remains that way. El Nino arises in the eastern Pacific, along the coast of South America.

ENSO forecast: The developing El Niño is expected to reach its height in late boreal summer and then continue at least through the winter. After the late winter, it will evolve into an El Niño Modoki.
Indian Ocean forecast: The probability of a negative IOD is very high in the tropical Indian Ocean during summer and fall.
Regional forecast: Most part of Europe, Africa, Middle East, Russia, India, and Southeastern Asia will experience a warmer-than-normal summer owing to the development of El Niño. In contrast, the Far East including Japan will experience a cooler summer. In the Southern Hemisphere, most parts of Australia and South Africa will be colder-than-normal in austral winter while most parts of Africa and South American Continent will be warmer-than-normal.
In the boreal fall, most parts of Europe, Africa, Middle East, Russia, India, Southeast Asia, and Mexico will be in a warmer-than-normal condition, whereas most parts of China, eastern-central part of U.S., southeastern Canada, Korea and Japan will be in a colder-than-normal condition. The unique combination of a negative IOD in the Indian Ocean and an El Nino in the Pacific is similar to the situation in 1993, a year of record-breaking cool summer in the northeastern part of Japan. Indian sub-continent will experience a drier than normal summer monsoon season.
The Maritime Continent in Asia, Caribbean countries, and West Africa will also be in a drier-than-normal condition in the boreal summer and fall owing to the El Niño. On the other hand, wetter-than-normal condition is predicted for U.S., Peru, Colombia, Ecuador, and northern Brazil. Above normal precipitation is also expected in Japan in summer because of the active and somewhat prolonged Baiu-season. In the austral spring, the southern African region will be in a drier-than-normal condition.

Amir Mohsen
متخصص بخش هواشناسی
El Niño has minimal effects on sector in Europe
In recent weeks, there have been regular media reports about El Niño, a weather change over the Pacific Ocean which affects South America, Australia and Southeast Asia. Headlines contradict each other, some predicting disastrous consequences while others tone down possible effects. Siemen van Berkum, attached to the LEI, primarily sees the messages as a warning. He expects that the impact on the fruit and vegetable sector will, at least in the Netherlands, be minimal.
The World Meteorological Organization (WMO) is one of the international organizations closely monitoring the developments of El Niño. The models on which the WMO bases its expectations, predict a bigger chance of an El Niño for the second half of this year. While there is always an element of uncertainty, it’s gradually becoming clearer that an El Niño is coming.
Foregone conclusions
"It is expected that the first signs of higher temperatures caused by El Niño will be visible in July and August," says Siemen van Berkum. "Consequences for cultivation and production will be noticeable for about a year, let’s say one growing season. Especially in countries around the Pacific, consequences will be observable. Australia, Philippines and Thailand might have to contend with drought. On the other side of the ocean there will be more rain.”

The force of an El Niño, foregone conclusions notwithstanding, is notoriously difficult to predict. Siemen van Berkum believes most reports are premature. "It is highly uncertain whether the effects and the strength of El Niño will be just as big as in 1997. The best thing to do is prepare yourself for some inconveniences and keep in mind that the consequences could be there. To panic, however, is premature."
Serious threat
El Niño though, should not be underestimated. In the markets for corn and soybean, Van Berkum can see prices rising already. But he adds immediately that there is no direct correlation between the price increases and El Niño. Other events, such as the unstable situation in Ukraine, is also affecting prices.

In the 1980s, damage to the agribusiness in South America amounted to hundreds of millions of dollars. Ecuador suffered a financial loss of 233.8 million dollars. For Peru, it was $ 649 million dollars and for Bolivia 716 million. The Brazilian states of Paraná and Santa Catarina had to contend with extreme rainfall and reduced harvests. The bean crop was 49.8 percent lower. Potatoes and apples suffered decreasing volumes of 27.4 and 22.5 percent respectively.
Little impact on the Netherlands
Referring to the FAO data, Siemen van Berkum expects the impact on food supply is relatively minimal. "Stocks can be supplemented. Lots of food stocks in Asia are higher than in recent years, especially after the good harvest last year.”
In the Netherlands, the consequences will be visible in higher prices for cattle feed. Siemen van Berkum: "I don’t think the Dutch sector will be much affected. The alternatives on the market are large. If there are countries which are affected, the Netherlands can reduce import from those countries and look for alternatives, for example, in Europe and the United States.”
Publication date: 6/18/2014
In recent weeks, there have been regular media reports about El Niño, a weather change over the Pacific Ocean which affects South America, Australia and Southeast Asia. Headlines contradict each other, some predicting disastrous consequences while others tone down possible effects. Siemen van Berkum, attached to the LEI, primarily sees the messages as a warning. He expects that the impact on the fruit and vegetable sector will, at least in the Netherlands, be minimal.
The World Meteorological Organization (WMO) is one of the international organizations closely monitoring the developments of El Niño. The models on which the WMO bases its expectations, predict a bigger chance of an El Niño for the second half of this year. While there is always an element of uncertainty, it’s gradually becoming clearer that an El Niño is coming.
Foregone conclusions
"It is expected that the first signs of higher temperatures caused by El Niño will be visible in July and August," says Siemen van Berkum. "Consequences for cultivation and production will be noticeable for about a year, let’s say one growing season. Especially in countries around the Pacific, consequences will be observable. Australia, Philippines and Thailand might have to contend with drought. On the other side of the ocean there will be more rain.”
The force of an El Niño, foregone conclusions notwithstanding, is notoriously difficult to predict. Siemen van Berkum believes most reports are premature. "It is highly uncertain whether the effects and the strength of El Niño will be just as big as in 1997. The best thing to do is prepare yourself for some inconveniences and keep in mind that the consequences could be there. To panic, however, is premature."
Serious threat
El Niño though, should not be underestimated. In the markets for corn and soybean, Van Berkum can see prices rising already. But he adds immediately that there is no direct correlation between the price increases and El Niño. Other events, such as the unstable situation in Ukraine, is also affecting prices.
In the 1980s, damage to the agribusiness in South America amounted to hundreds of millions of dollars. Ecuador suffered a financial loss of 233.8 million dollars. For Peru, it was $ 649 million dollars and for Bolivia 716 million. The Brazilian states of Paraná and Santa Catarina had to contend with extreme rainfall and reduced harvests. The bean crop was 49.8 percent lower. Potatoes and apples suffered decreasing volumes of 27.4 and 22.5 percent respectively.
Little impact on the Netherlands
Referring to the FAO data, Siemen van Berkum expects the impact on food supply is relatively minimal. "Stocks can be supplemented. Lots of food stocks in Asia are higher than in recent years, especially after the good harvest last year.”
In the Netherlands, the consequences will be visible in higher prices for cattle feed. Siemen van Berkum: "I don’t think the Dutch sector will be much affected. The alternatives on the market are large. If there are countries which are affected, the Netherlands can reduce import from those countries and look for alternatives, for example, in Europe and the United States.”
Publication date: 6/18/2014
Amir Mohsen
متخصص بخش هواشناسی
[h=2]Historical Probability of Seasonal Gridded Precipitation Tercile Conditioned on ENSO


These maps display the frequency with which 3-month seasonal precipitation totals were observed to be within the upper (wet) one-third, middle (normal) one-third, or bottom (dry) one-third (Tercile) of the historical (1950-2002) distribution given the state of ENSO (El Niño (nino), La Niña (nina)) during that same season.
For this analysis, El Niño and La Niña events are defined based upon the NINO3.4 SST anomaly index (averaged SST anomaly over the region 5°S to 5°N; 170°W-120°W). Both the precipitation amounts and the NINO3.4 index are defined for 3-month averaged seasons, and for 12 overlapping seasons in the year. The maps show the proportions of years that experienced above-, near-, and below-normal precipitation. As an example, a data point with a value of 0.6 for above-normal precipitation, 0.3 for near-normal precipitation, and 0.1 for below-normal precipitation in a particular season would indicate that for the years in which NINO3.4 reached its warmest values during 1950-2002, 6 out of 10 of those years experienced above-normal precipitation over that grid point in that season, 3 out of 10 experienced near-normal precipitation, and 1 out of 10 experienced below-normal precipitation.
The precipitation data used here are from the University of East Anglia Climatic Research Unit TS2.1 dataset. These are monthly gridded precipitation data based entirely upon rain gauge data interpolated spatially to give a dataset at 0.5° resolution and no missing data points over land. Here the analysis is also provided on a coarser resolution grid, spatially averaged to 2.5° resolution. Significance masking may also be applied to the analysis. The prior probabilities that any subset of years, drawn at random from the 1950-2002 sample should have experienced above-, near-, or below-normal precipitation are the climatological probabilities of 33.3% for each category. Thus, one would like to know how significantly different from the climatological probabilities is that obtained from a set of 10 ENSO years. Using the hypergeometric equation to estimate confidence levels, it is found that at least 6 cases out of 10 would be considered statistically significant at the 90% confidence level. Use the controls above the figure to select the season, ENSO state, precipitation category of interest, region of interest, spatial resolution of the gridded precipitation data, and whether to apply the 90% significance mask.
آخرین ویرایش:
Amir Mohsen
متخصص بخش هواشناسی
نمی دونم چرا سازمان هواشناسی استرالیا به یکباره نظرش رو تغییر داده، این سازمان ال نینوی امسال رو لغو کرده و بر اساس مدل هاش، انسو تا بهار سال آینده در فاز خنثی قرار خواهد داشت!!
ورود مجدد انسو به فاز خنثی از اوایل همین هفته (44.0+)
امیر کوروش جان
لینک خبر رو بذار تا ببینم دقیقا چی نوشته!!!!


Amir Mohsen
متخصص بخش هواشناسی
امیر کوروش جان در تاریخ 9 ژوئن این خبر منتشر شده بوده که امکان داره النینو به سمت لانینا پیش بره و دو قطبی اقیانوس هند به نفع مونسون تغییر فاز بده و اینهم لینک خبرش:
http://www.theindianrepublic.com/na...-australian-bureau-meteorology-100039174.html
ولی در تاریخ 17 ژوئن آخرین اظهار نظریکه از سوی هواشناسی استرالیا شده به شرح ذیل هست :
Australia sees chance of El Nino at 70 percent, some signs ease

By By Colin Packham
June 17, 2014 1:54 AM
By Colin PackhamSYDNEY (Reuters) - Australia's weather bureau said on Tuesday the chance of an El Nino forming over the next few months remains at 70 percent, though the agency said some key indicators associated with the weather pattern had eased in recent weeks.
"We still believe an El Nino is likely," Andrew Watkins, Supervisor Climate Prediction at the Australian Bureau of Meteorology, said."The recent observations may suggest a later El Nino and it has perhaps reduced the chance of very strong El Nino like we saw in 1997/1998."The bureau said ocean warming had leveled off, counter to typical observations prior to previous El Nino events when temperatures continued to rise.The agency also said it had observed a recent positive value for the Southern Oscillation Index - a measure of large-scale fluctuations in air pressure occurring between the western and eastern tropical Pacific. A positive value is linked to abnormally cold ocean waters across the eastern tropical Pacific associated with an opposite La Nina weather event.However, despite the easing of some indicators, the Australian bureau said it continued to expected an El Nino in the southern hemisphere's 2014 spring.El Nino - a warming of sea temperatures in the Pacific - affects wind patterns and can trigger both floods and drought in different parts of the globe, hitting crops and food supply.U.S. and Japanese weather forecasters also expect an El Nino to develop.(Reporting by Colin Packham; Editing by Ed Davies)
"We still believe an El Nino is likely," Andrew Watkins, Supervisor Climate Prediction at the Australian Bureau of Meteorology, said."The recent observations may suggest a later El Nino and it has perhaps reduced the chance of very strong El Nino like we saw in 1997/1998."The bureau said ocean warming had leveled off, counter to typical observations prior to previous El Nino events when temperatures continued to rise.The agency also said it had observed a recent positive value for the Southern Oscillation Index - a measure of large-scale fluctuations in air pressure occurring between the western and eastern tropical Pacific. A positive value is linked to abnormally cold ocean waters across the eastern tropical Pacific associated with an opposite La Nina weather event.However, despite the easing of some indicators, the Australian bureau said it continued to expected an El Nino in the southern hemisphere's 2014 spring.El Nino - a warming of sea temperatures in the Pacific - affects wind patterns and can trigger both floods and drought in different parts of the globe, hitting crops and food supply.U.S. and Japanese weather forecasters also expect an El Nino to develop.(Reporting by Colin Packham; Editing by Ed Davies)
آخرین گزارش اینطوری بوده که هواشناسی استرالیا هنوز اعتقاد داره که در ماههای آینده النینو با شانس 70 درصد امکان وقوع داره ولی شانس وقوع النینو قوی مشابه اونچیزیکه در بازه زمانی 1997 و 1998 رخ داد کاهش یافته !
در انتهای این مطلب هم نوشته که هواشناسان امریکایی و ژاپنی همچنان اعتقاد دارند که بروز پدیده النینو قطعی خواهد بود
Amir Mohsen
متخصص بخش هواشناسی
NOAA: Why do El Niño-Southern Oscillation (ENSO) Weather Forecasts Use Probabilities?
Last Updated on Sunday, 22 June 2014 05:12
June 19, 2014 - By Anthony Barnston - Many people are interested in knowing which ENSO category (La Niña, neutral or El Niño) is expected by the climate experts, just as they might want to know the weather forecast for tomorrow.
They usually prefer a simple answer—one with little or no uncertainty. Unfortunately, however, weather and climate forecasts are never about certainty: they’re about probability. Using probabilities allows us to describe the uncertainty in quantitative terms. If there were no uncertainty about what the climate would be like in the future, then one outcome would be given a 100% chance of occurring, while any other outcome(s) would have a 0% chance. While probabilities near 0% and 100% often occur in astronomy and solid state physics problems, they are virtually nonexistent in weather and climate forecasting, due to the fluid and chaotic nature of the ocean and the atmosphere.
Let’s take the example of the bar chart below, showing the latest forecast probabilities for the three ENSO categories for 3-month periods going out to early 2015, issued by CPC/IRI on June 5. How should we interpret this chart?
For each season forecasted, the heights of the three bars indicate the current probabilities for La Niña (blue), ENSO-neutral (gray), and El Niño (red). The sum of the three probabilities for each bar cluster must always add to 100%, because no other outcomes are possible: the sea surface temperature (SST) in the Niño3.4 region has to be either colder than average by a sufficient amount (La Niña), warmer than average by a sufficient amount (El Niño), or near average (neutral). Currently, the official sufficient amount of deviation from average is 0.5?C.
For all of the seasons being predicted in this particular forecast, El Niño is the most likely category, with the red bars towering over the other bars. During the latter part of 2014 its probability is near or above 80%. This is a fairly confident forecast for El Niño, but it does still leave about a 20% (1 in 5) chance of it not happening.

Vertical bar histogram showing probabilities for La Niña, neutral, and El Niño conditions for the remainder of 2014 and into early 2015. Dashed lines show climatological (historical average) probabilities for these same three ENSO conditions. Chart by NOAA Climate.gov, based on data provided by IRI.
So what does historical probability tell us?
An 80% chance is a pretty high probability, which means if the climate were a betting game, we’d be wise to bet on El Niño. But what if the models predicted that the odds of El Niño this winter were 50%? Should we shrug that off?
This is where it helps to have a second kind of information: the climatological probability—the average odds of El Niño, La Niña, and neutral conditions based on how frequently they’ve occurred over a long historical record.
When people envision random chance (“we don't know”), they may think of a two-sided coin flip, with each side having a 50% chance of occurring. However, in the case of ENSO forecasting there are three possible outcomes: El Niño, neutral, and La Niña. Imagine a coin with a very thick edge, so that the chances of getting heads, tails, or having the coin land on its edge are all 33.3%. For any random coin toss—any given season we might consider—intuition might tell us there is a 1 in 3 chance of it being an El Niño season.
While a 1 in 3 chance of El Niño, neutral, or La Niña is a reasonable starting point for a “first guess” as to what we might expect, observations from a recent 30-year period tell a somewhat different story. Those baseline, or climatological probabilities, are shown on the chart as dashed lines.
[HIGHLIGHT]As you can see in the figure, the climatological probabilities are not flat, horizontal lines at 33.3% all year round. Rather, they vary noticeably by season. Looking at the lines on the figure, we see that during NDJ (November-December-January), the climatological probability for El Niño or La Niña is higher than at any other time of the year, and exceeds 35% for each, leaving less than a 30% likelihood for neutral ENSO. By contrast, during the late spring and summer the reverse is true, as the typical chance of neutral conditions exceeds 50%[/HIGHLIGHT].
[HIGHLIGHT]Any bar that is greater than the dashed line of the same color (showing the climatological probability) indicates a heightened chance of that ENSO category occurring relative to the historical average. For example, in the case of the second season being forecast in the figure (JJA), the probability of El Niño is 69% (red bar), but the climatological probability is only 26% (red line), meaning that the chance of it occurring is considerably higher than average—more than double.
[/HIGHLIGHT]The difference between the forecast probability and the climatological probability, called theprobability anomaly (69% minus 26%, or 43% in this example), can be important in decision-making, such as in the case when El Niño is associated with drought and/or increased forest fire danger. When a consequence is negative, the probability anomaly may be as important as the actual probability in terms of preparedness for adverse impacts.
[HIGHLIGHT]Going back to our hypothetical example, if the probability of El Niño this winter were 50% instead of 80%, that would still represent an increase of 24% above the historical average odds. If we were trying to evaluate risk or vulnerability to an EL Niño-related impact, it would help us to consider the odds within the longer-term context[/HIGHLIGHT].
Why are the odds different in different seasons?
This seasonal difference in the climatolological probabilities of El Niño or La Niña is related to the fact that, during fall, the year-to-year variability of the sea surface temperature (SST) in the Niño3.4 region is usually larger than it is in the spring, so that excursions below -0.5C or above 0.5C are more frequent in fall. This seasonal change in the amount of variability is consistent with the fact that that spring is often the time of year when El Niño or La Niña events are either at their very beginning or have just ended, so the SSTs tend to be closer to their average, while during fall and early winter, ENSO events are in full swing and typically peak.
Although an explanation of why ENSO events follow this seasonal cycle is not fully known and is still being actively researched, facts that are agreed to play a role are, first, that the normal SST in the Niño3.4 region follows a seasonal cycle in which it is warmest during April to June each year, and coldest during November to January.
It is thought that El Niño is encouraged to develop around May because it is usually the basin’s warmest time of year. If other conditions are also met—such as westerly low level wind anomalies that can warm the ocean temperatures above their average, as we observed early this year—the basin is already in a favorable, warm state.
As for why ENSO events tend to dissipate about 9-12 months later, there is a theory calledDelayed Oscillator Theory (Suarez and Schopf 1988), in which the low-level westerly wind anomalies trigger two oceanic waves—first, a Kelvin wave that moves to the east and increases the oceanic heat content to the east of the anomalous wind location; and second, a Rossby wave that moves to the west until it hits the Indonesia land mass. The Rossby wave then reflects back toward the east as a “reverse” Kelvin wave, and it acts to cool the subsurface. The cooling subsequently ends the El Niño episode (and sometimes even triggers a La Niña event) about 10 months after it had begun.
The nearly one year time duration of the episode is due to the speeds of the two waves, and the distance between the west and east boundaries of the equatorial Pacific (Indonesia to South America). La Niña is thought to operate approximately symmetrically oppositely to El Niño in these dynamics. It should be noted that the “Delayed Oscillator Theory” is not the only existing hypothesis explaining the typical duration of an ENSO event, but it is one of the most actively researched. More detail about this theory, with illustrative diagrams, is available on a number of links on the Web, such as http://orca.rsmas.miami.edu/~melicie/dmodel1.htm.
Last Updated on Sunday, 22 June 2014 05:12
June 19, 2014 - By Anthony Barnston - Many people are interested in knowing which ENSO category (La Niña, neutral or El Niño) is expected by the climate experts, just as they might want to know the weather forecast for tomorrow.
They usually prefer a simple answer—one with little or no uncertainty. Unfortunately, however, weather and climate forecasts are never about certainty: they’re about probability. Using probabilities allows us to describe the uncertainty in quantitative terms. If there were no uncertainty about what the climate would be like in the future, then one outcome would be given a 100% chance of occurring, while any other outcome(s) would have a 0% chance. While probabilities near 0% and 100% often occur in astronomy and solid state physics problems, they are virtually nonexistent in weather and climate forecasting, due to the fluid and chaotic nature of the ocean and the atmosphere.
Let’s take the example of the bar chart below, showing the latest forecast probabilities for the three ENSO categories for 3-month periods going out to early 2015, issued by CPC/IRI on June 5. How should we interpret this chart?
For each season forecasted, the heights of the three bars indicate the current probabilities for La Niña (blue), ENSO-neutral (gray), and El Niño (red). The sum of the three probabilities for each bar cluster must always add to 100%, because no other outcomes are possible: the sea surface temperature (SST) in the Niño3.4 region has to be either colder than average by a sufficient amount (La Niña), warmer than average by a sufficient amount (El Niño), or near average (neutral). Currently, the official sufficient amount of deviation from average is 0.5?C.
For all of the seasons being predicted in this particular forecast, El Niño is the most likely category, with the red bars towering over the other bars. During the latter part of 2014 its probability is near or above 80%. This is a fairly confident forecast for El Niño, but it does still leave about a 20% (1 in 5) chance of it not happening.
Vertical bar histogram showing probabilities for La Niña, neutral, and El Niño conditions for the remainder of 2014 and into early 2015. Dashed lines show climatological (historical average) probabilities for these same three ENSO conditions. Chart by NOAA Climate.gov, based on data provided by IRI.
So what does historical probability tell us?
An 80% chance is a pretty high probability, which means if the climate were a betting game, we’d be wise to bet on El Niño. But what if the models predicted that the odds of El Niño this winter were 50%? Should we shrug that off?
This is where it helps to have a second kind of information: the climatological probability—the average odds of El Niño, La Niña, and neutral conditions based on how frequently they’ve occurred over a long historical record.
When people envision random chance (“we don't know”), they may think of a two-sided coin flip, with each side having a 50% chance of occurring. However, in the case of ENSO forecasting there are three possible outcomes: El Niño, neutral, and La Niña. Imagine a coin with a very thick edge, so that the chances of getting heads, tails, or having the coin land on its edge are all 33.3%. For any random coin toss—any given season we might consider—intuition might tell us there is a 1 in 3 chance of it being an El Niño season.
While a 1 in 3 chance of El Niño, neutral, or La Niña is a reasonable starting point for a “first guess” as to what we might expect, observations from a recent 30-year period tell a somewhat different story. Those baseline, or climatological probabilities, are shown on the chart as dashed lines.
[HIGHLIGHT]As you can see in the figure, the climatological probabilities are not flat, horizontal lines at 33.3% all year round. Rather, they vary noticeably by season. Looking at the lines on the figure, we see that during NDJ (November-December-January), the climatological probability for El Niño or La Niña is higher than at any other time of the year, and exceeds 35% for each, leaving less than a 30% likelihood for neutral ENSO. By contrast, during the late spring and summer the reverse is true, as the typical chance of neutral conditions exceeds 50%[/HIGHLIGHT].
[HIGHLIGHT]Any bar that is greater than the dashed line of the same color (showing the climatological probability) indicates a heightened chance of that ENSO category occurring relative to the historical average. For example, in the case of the second season being forecast in the figure (JJA), the probability of El Niño is 69% (red bar), but the climatological probability is only 26% (red line), meaning that the chance of it occurring is considerably higher than average—more than double.
[/HIGHLIGHT]The difference between the forecast probability and the climatological probability, called theprobability anomaly (69% minus 26%, or 43% in this example), can be important in decision-making, such as in the case when El Niño is associated with drought and/or increased forest fire danger. When a consequence is negative, the probability anomaly may be as important as the actual probability in terms of preparedness for adverse impacts.
[HIGHLIGHT]Going back to our hypothetical example, if the probability of El Niño this winter were 50% instead of 80%, that would still represent an increase of 24% above the historical average odds. If we were trying to evaluate risk or vulnerability to an EL Niño-related impact, it would help us to consider the odds within the longer-term context[/HIGHLIGHT].
Why are the odds different in different seasons?
This seasonal difference in the climatolological probabilities of El Niño or La Niña is related to the fact that, during fall, the year-to-year variability of the sea surface temperature (SST) in the Niño3.4 region is usually larger than it is in the spring, so that excursions below -0.5C or above 0.5C are more frequent in fall. This seasonal change in the amount of variability is consistent with the fact that that spring is often the time of year when El Niño or La Niña events are either at their very beginning or have just ended, so the SSTs tend to be closer to their average, while during fall and early winter, ENSO events are in full swing and typically peak.
Although an explanation of why ENSO events follow this seasonal cycle is not fully known and is still being actively researched, facts that are agreed to play a role are, first, that the normal SST in the Niño3.4 region follows a seasonal cycle in which it is warmest during April to June each year, and coldest during November to January.
It is thought that El Niño is encouraged to develop around May because it is usually the basin’s warmest time of year. If other conditions are also met—such as westerly low level wind anomalies that can warm the ocean temperatures above their average, as we observed early this year—the basin is already in a favorable, warm state.
As for why ENSO events tend to dissipate about 9-12 months later, there is a theory calledDelayed Oscillator Theory (Suarez and Schopf 1988), in which the low-level westerly wind anomalies trigger two oceanic waves—first, a Kelvin wave that moves to the east and increases the oceanic heat content to the east of the anomalous wind location; and second, a Rossby wave that moves to the west until it hits the Indonesia land mass. The Rossby wave then reflects back toward the east as a “reverse” Kelvin wave, and it acts to cool the subsurface. The cooling subsequently ends the El Niño episode (and sometimes even triggers a La Niña event) about 10 months after it had begun.
The nearly one year time duration of the episode is due to the speeds of the two waves, and the distance between the west and east boundaries of the equatorial Pacific (Indonesia to South America). La Niña is thought to operate approximately symmetrically oppositely to El Niño in these dynamics. It should be noted that the “Delayed Oscillator Theory” is not the only existing hypothesis explaining the typical duration of an ENSO event, but it is one of the most actively researched. More detail about this theory, with illustrative diagrams, is available on a number of links on the Web, such as http://orca.rsmas.miami.edu/~melicie/dmodel1.htm.
Amir Mohsen
متخصص بخش هواشناسی
[HIGHLIGHT] Published: Sunday June 22, 2014 MYT 12:00:00 AM
Updated: Sunday June 22, 2014 MYT 7:18:12 AM
[/HIGHLIGHT] [h=2]El Nino this year won’t be extreme, says dept
PETALING JAYA: Unlike the extreme El Nino in 1997 and 1998, the effects this year may not cause widespread or prolonged water shortages, said the Meteorological Department.
[HIGHLIGHT] Spokesman Dr Hisham Mohd Anip said the intensity of this year’s El Nino would be weak and moderate[/HIGHLIGHT].
“The good news is that we may not see the dry dams and taps which we had in 1997 and 1998,” he told The Star.
Dr Hisham pointed out that the last El Nino, between 2009 and 2010, was also moderate and passed with little impact.
“Nobody even noticed,” he said.
However, he pointed out that their El Nino analysis was a long-term forecast and underscored that mother nature was unpredictable.
Dr Hisham said the global weather phenomenon occurred every four years on average and could last up to 18 months.
“It develops in the middle of the year and matures in December or January before it weakens and ends in March,” he said.
El Ninos starts with the unusual warming of the ocean surface in the tropics before it spreads and affects other parts of the globe.
The last extreme El Nino reportedly resulted in the deaths of an estimated 23,000 people around the world due to extreme hot weather, drought, wildfires, floods and cyclones.
Dr Hisham said that most of Malaysia had good or moderate Air Pollutant Index (API) readings yesterday.
“We are still in a dry period, which will last for one or two weeks, and there could be some haze,” he said, adding that there should be more rain next month.
Updated: Sunday June 22, 2014 MYT 7:18:12 AM
[/HIGHLIGHT] [h=2]El Nino this year won’t be extreme, says dept
|
|
PETALING JAYA: Unlike the extreme El Nino in 1997 and 1998, the effects this year may not cause widespread or prolonged water shortages, said the Meteorological Department.
[HIGHLIGHT] Spokesman Dr Hisham Mohd Anip said the intensity of this year’s El Nino would be weak and moderate[/HIGHLIGHT].
“The good news is that we may not see the dry dams and taps which we had in 1997 and 1998,” he told The Star.
Dr Hisham pointed out that the last El Nino, between 2009 and 2010, was also moderate and passed with little impact.
“Nobody even noticed,” he said.
However, he pointed out that their El Nino analysis was a long-term forecast and underscored that mother nature was unpredictable.
Dr Hisham said the global weather phenomenon occurred every four years on average and could last up to 18 months.
“It develops in the middle of the year and matures in December or January before it weakens and ends in March,” he said.
El Ninos starts with the unusual warming of the ocean surface in the tropics before it spreads and affects other parts of the globe.
The last extreme El Nino reportedly resulted in the deaths of an estimated 23,000 people around the world due to extreme hot weather, drought, wildfires, floods and cyclones.
Dr Hisham said that most of Malaysia had good or moderate Air Pollutant Index (API) readings yesterday.
“We are still in a dry period, which will last for one or two weeks, and there could be some haze,” he said, adding that there should be more rain next month.

